

Production line discrete-event simulator with live KPIs, OEE and Little's Law
Claude Opus 5.5 built a single-file Canvas simulator of a serial production line, with animated stations and buffers plus a live dashboard of throughput, WIP and OEE.
디테일한 3D 모델 만들기
코드만으로는 단순한 도형밖에 만들 수 없어요. Wandy 2는 사진 한 장을 같은 장면에 바로 쓸 수 있는 텍스처 3D 모델로 바꿔 줘요.
Claude Opus 5.5 프롬프트
Build an animated, interactive discrete-event simulation of a serial production line as a single self-contained HTML file (vanilla JS + Canvas, no external libraries except Chart.js from cdnjs). Purpose: teaching [Manufacturing Systems] students how variability, buffers, and breakdowns affect line performance.

LINE CONFIGURATION (user-adjustable)
- Number of stations: [2–6], default [3], each with a name (e.g., Machining, Assembly, Inspection)
- Per station: mean cycle time, distribution (Deterministic, Uniform, Normal, Triangular, Exponential, Lognormal), CV
- Breakdowns per station: MTBF and MTTR (exponential), on/off toggle
- Quality per station: defect rate (%), with scrap or rework-loop option
- Buffers between stations: capacity 0–10 (0 = blocking after service)
- Arrivals: unlimited raw material OR Poisson arrivals with rate λ
- Customer demand to compute takt time

ANIMATION
- Parts move along conveyors and change color by stage (raw, WIP, finished, scrap)
- Machine borders show state colors: Working (green), Blocked (amber), Starved (red), Down (gray), plus a rotating gear icon and a progress bar
- Buffer slots show occupancy and highlight when full
- Controls: Play/Pause, Step, Reset, speed 1x–50x, warm-up period

KEY PERFORMANCE MEASURES (live dashboard)
1. Throughput (parts/hr) vs theoretical bottleneck rate
2. Average WIP and WIP over time
3. Flow time / manufacturing lead time (mean and 95th percentile)
4. Little's Law check: WIP ≈ Throughput × Flow time
5. Per-station utilization with a time breakdown: working / blocked / starved / down (stacked bar)
6. OEE per station = Availability × Performance × Quality
7. Bottleneck detection (active-period method) and highlight the bottleneck
8. Takt time vs station cycle times (line balance chart)
9. Line balance efficiency = Σ cycle times / (N × max cycle time)
10. First-pass yield, rolled throughput yield, scrap count
11. Average buffer occupancy per buffer
12. Observed vs set cycle-time mean and CV per station

ANALYSIS FEATURES
- Replication mode: run N replications of length T after warm-up, report mean ± 95% confidence interval for throughput, WIP, and flow time
- Experiment mode: sweep buffer size (or one station's CV) and plot throughput vs parameter
- Export results to CSV
- Preset scenarios: Balanced line, Clear bottleneck, High variability, Unreliable machine

DESIGN
- Clean, responsive layout that works on mobile; light/dark mode
- Brief tooltip explaining each KPI and its formula
- Bilingual labels (English/Arabic) toggle
프롬프트 사용 방법
Paste the prompt into Claude Opus 5.5 in a chat or coding tool, filling the bracketed fields with your course, station count and range.
Edit the station names, distributions, breakdown settings, presets and language toggle to match your own line.
Open the single HTML file, run a preset and watch the bottleneck appear; ask for extra KPIs or experiments and iterate.
Wandy3D 제공
 Wandy3D 제공
장면에 진짜 3D 모델이 필요하신가요?
에이전트는 기본 도형으로 장면을 만들어요. Wandy3D API는 사진이나 프롬프트를 몇 분 만에 텍스처가 입혀진 GLB로 바꿔 줘요. 구독 없이 선불 잔액에서 결제돼요.
- Wandy 2모델당 US$0.18
- Wandy 1모델당 US$0.09
잔액은 만료되지 않아요 · 실패한 작업은 환불돼요 · API로 만든 모델은 회원님 소유이며 모든 형식으로 다운로드할 수 있어요.
curl -s -X POST https://api.wandy3d.com/generate/cloud/ultra \ -H "Authorization: Bearer $WANDY3D_API_KEY" -F "file=@photo.jpg"# → {"task_id": "…"} — poll until "status" is "done":curl -s https://api.wandy3d.com/task/$TASK_ID/status \ -H "Authorization: Bearer $WANDY3D_API_KEY"# → {"model_id": "…"} — then GET /model/$MODEL_ID/export?format=glb원본 게시물작성자이신가요? 이 페이지의 수정이나 삭제를 요청하세요
비슷한 프롬프트
모든 프롬프트 보기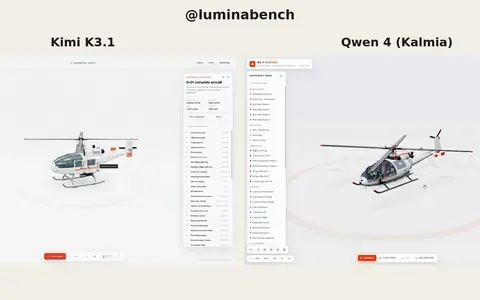 Kimi K3.1
Interactive 3D helicopter with takeoff, assembly and exploded views
Lumina
 Claude Opus 5.5
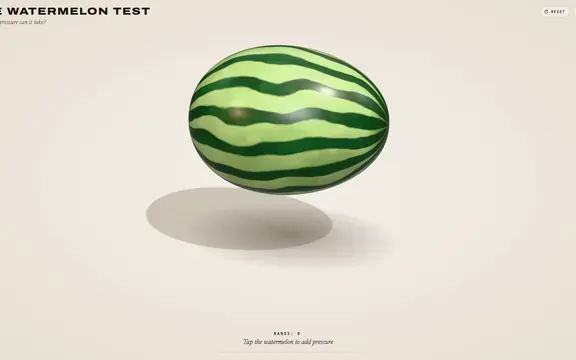
Rubber band watermelon test: a squeezable, bursting 3D browser toy
林悦己Cheer
 Claude Opus 5.5
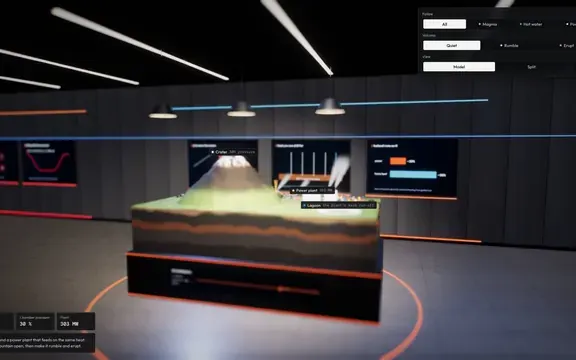
Interactive 3D volcano cutaway simulation with magma chamber
Konstantin Saifoulline
 Claude Opus 5.5
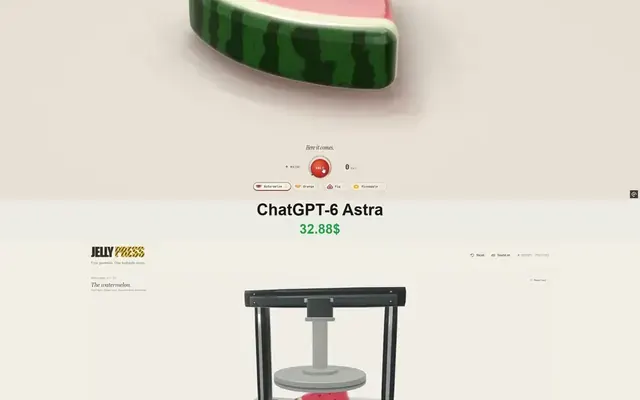
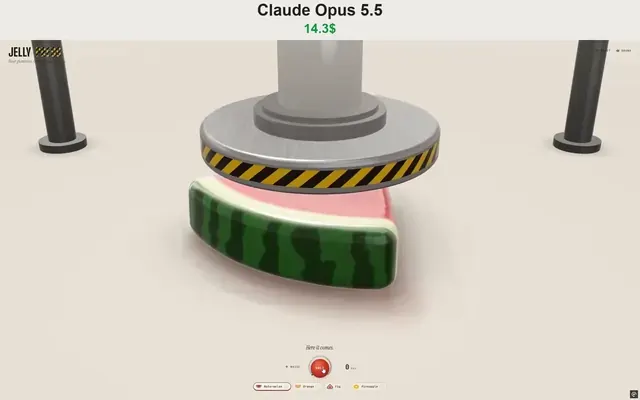
WebGPU jelly press toy: gummy fruit squashed and burst by a hydraulic press
Vib3Coded
 Claude Opus 5.5
Single-file WebGPU jelly press toy with soft-body fruit gummies
Vib3Coded
 Claude Opus 5.5
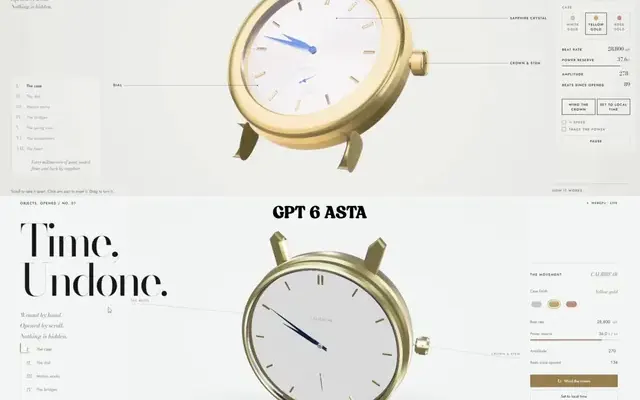
Scroll-driven exploding mechanical watch in raw WebGPU, single HTML file
Paruchh