

NYタクシー1か月分のインタラクティブ3Dアトラス(Three.js)
AstraとThree.jsで、NYのタクシーデータ1か月分を3D化。時間ごとの再生、24時間の展開表示、日ごとの比較ができます。
Claude Code + Three.js(コードのみ)Wandy 2
精細な3Dモデルを作ろう
コードだけでは単純な形しか作れません。Wandy 2なら写真1枚から、同じシーンで使えるテクスチャ付き3Dモデルを作れます。
Wandy3Dによる制作ブリーフ
作者がプロンプトを公開していないため、この作品を再現する方法を私たちがまとめました。
Build an interactive 3D data atlas of New York City taxi movement with Three.js. Draw the 263 taxi zones as dark blue extruded polygons on a night-style map, and show trip volume as glowing bars. Provide four view modes: connections between zones, volume by hour, all 24 hours unfolded side by side, and a comparison view that sets each day against its typical weekday or weekend pattern. Add an hour clock with play and scrub controls to replay a month of 31 days, orbit and zoom camera controls, and a side panel with the selected zone, pickup counts, percentage change and a small hourly line chart. Use a dark UI with cool blue and white highlights. Load the data from a prepared aggregate file. Done means switching views animates smoothly and the stats update with the hour and zone.
このプロンプトの使い方
コーディングツールでGPT-6 Astraにビルドブリーフと、集計済みの小さな走行データを渡します。
都市、データソース、指標、配色を自分用に差し替え、必要な表示モードを調整します。
ページを開いて時計を動かし、表示を切り替え、ラベルやグラフ、カメラの修正を依頼します。
元の投稿作者の方ですか? このページの修正・削除をご依頼ください
似ているプロンプト
すべてのプロンプトを見る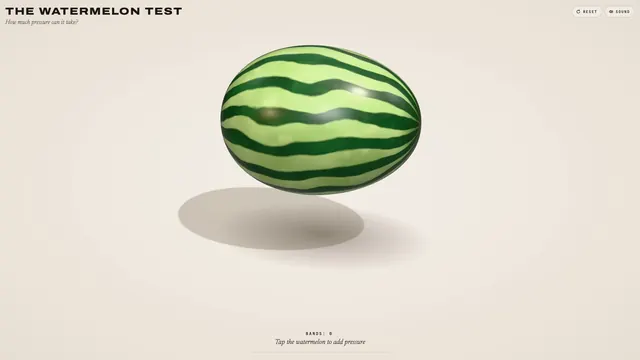 Claude Opus 5.5
輪ゴムスイカ実験を再現した、弾ける3Dブラウザおもちゃ
林悦己Cheer
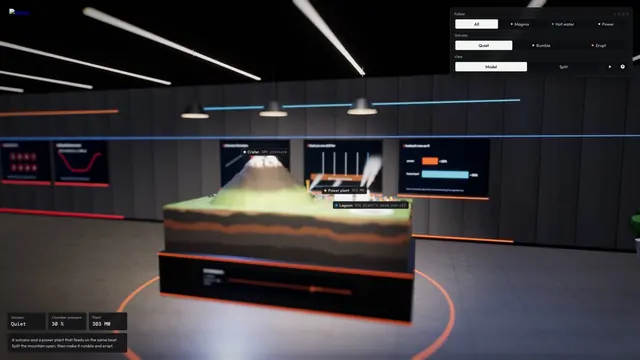 Claude Opus 5.5
マグマだまりを備えたインタラクティブ3D火山断面シミュレーション
Konstantin Saifoulline
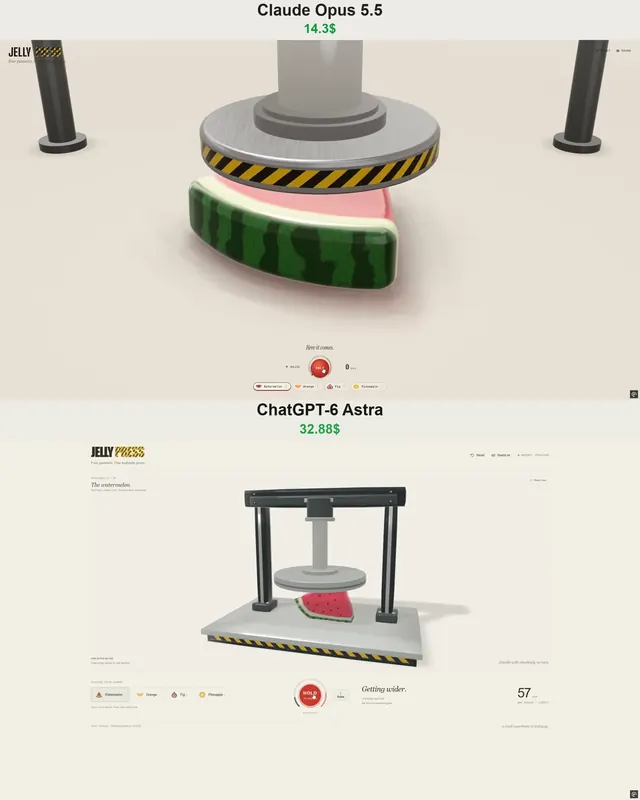 Claude Opus 5.5
WebGPUのゼリープレス:油圧プレスで潰れて弾けるフルーツゼリー
Vib3Coded
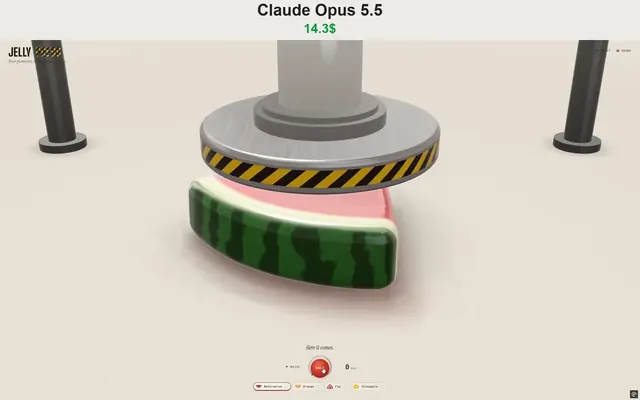 Claude Opus 5.5
WebGPUで動くジェリープレス玩具:果物グミを潰して投げる
Vib3Coded
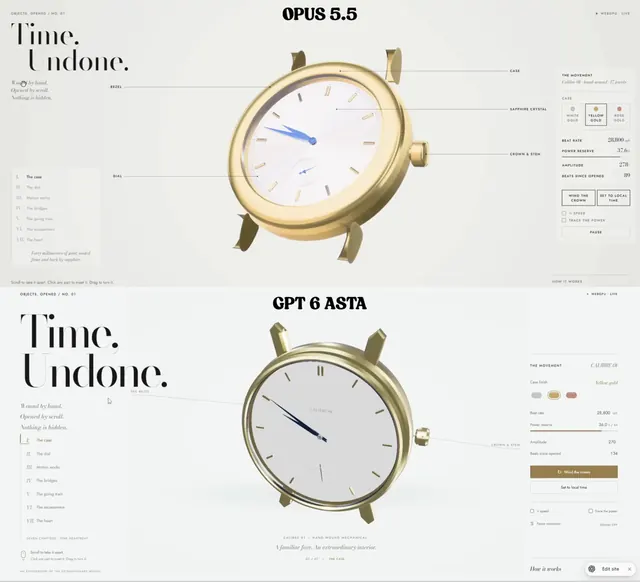 Claude Opus 5.5
スクロールで分解される機械式腕時計、WebGPUの単一HTML
Paruchh
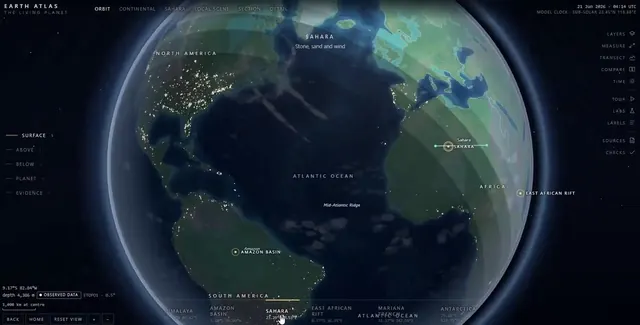 Claude Opus 5.5
地球儀・探検・内部断面を備えた単一ファイルのSVGインタラクティブ地球アトラス
Gadgetify