

KPI・OEE・リトルの法則を表示する生産ラインの離散事象シミュレータ
Claude Opus 5.5が単一ファイルのCanvasシミュレータを作成。工程とバッファがアニメーションし、スループット・WIP・OEEをライブ表示します。
Claude Code + Three.js(コードのみ)Wandy 2
精細な3Dモデルを作ろう
コードだけでは単純な形しか作れません。Wandy 2なら写真1枚から、同じシーンで使えるテクスチャ付き3Dモデルを作れます。
Claude Opus 5.5のプロンプト
Build an animated, interactive discrete-event simulation of a serial production line as a single self-contained HTML file (vanilla JS + Canvas, no external libraries except Chart.js from cdnjs). Purpose: teaching [Manufacturing Systems] students how variability, buffers, and breakdowns affect line performance.

LINE CONFIGURATION (user-adjustable)
- Number of stations: [2–6], default [3], each with a name (e.g., Machining, Assembly, Inspection)
- Per station: mean cycle time, distribution (Deterministic, Uniform, Normal, Triangular, Exponential, Lognormal), CV
- Breakdowns per station: MTBF and MTTR (exponential), on/off toggle
- Quality per station: defect rate (%), with scrap or rework-loop option
- Buffers between stations: capacity 0–10 (0 = blocking after service)
- Arrivals: unlimited raw material OR Poisson arrivals with rate λ
- Customer demand to compute takt time

ANIMATION
- Parts move along conveyors and change color by stage (raw, WIP, finished, scrap)
- Machine borders show state colors: Working (green), Blocked (amber), Starved (red), Down (gray), plus a rotating gear icon and a progress bar
- Buffer slots show occupancy and highlight when full
- Controls: Play/Pause, Step, Reset, speed 1x–50x, warm-up period

KEY PERFORMANCE MEASURES (live dashboard)
1. Throughput (parts/hr) vs theoretical bottleneck rate
2. Average WIP and WIP over time
3. Flow time / manufacturing lead time (mean and 95th percentile)
4. Little's Law check: WIP ≈ Throughput × Flow time
5. Per-station utilization with a time breakdown: working / blocked / starved / down (stacked bar)
6. OEE per station = Availability × Performance × Quality
7. Bottleneck detection (active-period method) and highlight the bottleneck
8. Takt time vs station cycle times (line balance chart)
9. Line balance efficiency = Σ cycle times / (N × max cycle time)
10. First-pass yield, rolled throughput yield, scrap count
11. Average buffer occupancy per buffer
12. Observed vs set cycle-time mean and CV per station

ANALYSIS FEATURES
- Replication mode: run N replications of length T after warm-up, report mean ± 95% confidence interval for throughput, WIP, and flow time
- Experiment mode: sweep buffer size (or one station's CV) and plot throughput vs parameter
- Export results to CSV
- Preset scenarios: Balanced line, Clear bottleneck, High variability, Unreliable machine

DESIGN
- Clean, responsive layout that works on mobile; light/dark mode
- Brief tooltip explaining each KPI and its formula
- Bilingual labels (English/Arabic) toggle
このプロンプトの使い方
Claude Opus 5.5にプロンプトを貼り、角括弧の項目(科目、工程数、範囲)を自分の内容に置き換えます。
工程名、分布、故障設定、プリセット、言語切替を自分のラインに合わせて編集します。
HTMLを開いてプリセットを実行し、ボトルネックを確認。KPIや実験の追加を依頼して改良しましょう。
元の投稿作者の方ですか? このページの修正・削除をご依頼ください
似ているプロンプト
すべてのプロンプトを見る Claude Opus 5.5
輪ゴムスイカ実験を再現した、弾ける3Dブラウザおもちゃ
林悦己Cheer
 Claude Opus 5.5
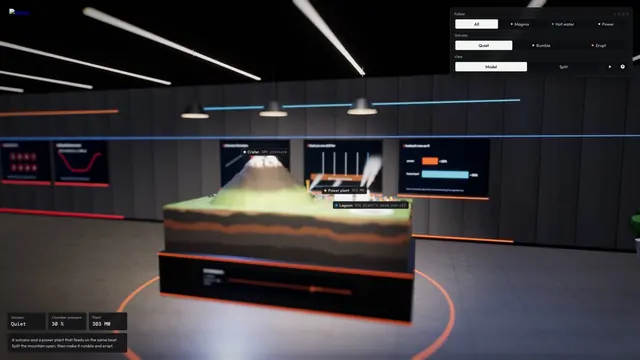
マグマだまりを備えたインタラクティブ3D火山断面シミュレーション
Konstantin Saifoulline
 Claude Opus 5.5
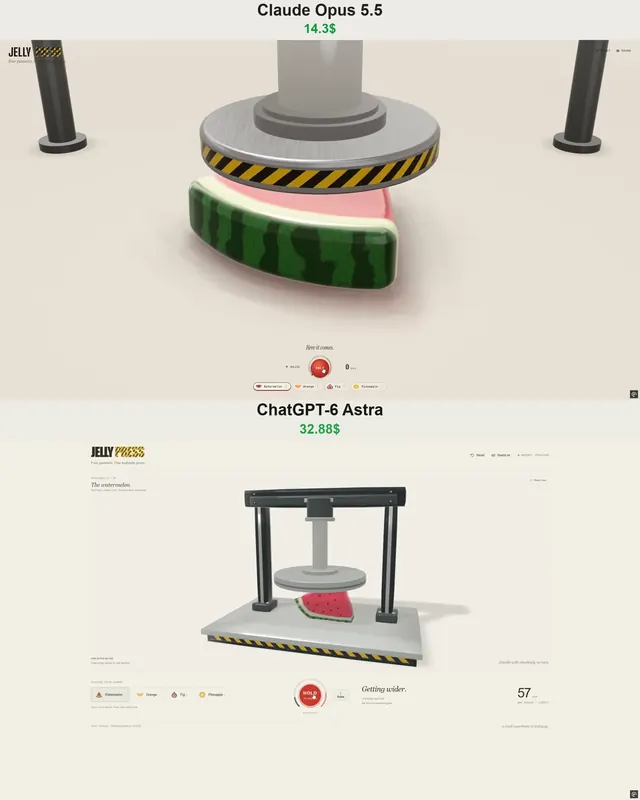
WebGPUのゼリープレス:油圧プレスで潰れて弾けるフルーツゼリー
Vib3Coded
 Claude Opus 5.5
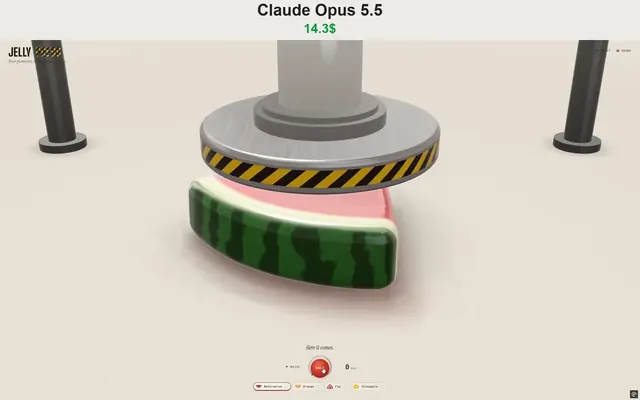
WebGPUで動くジェリープレス玩具:果物グミを潰して投げる
Vib3Coded
 Claude Opus 5.5
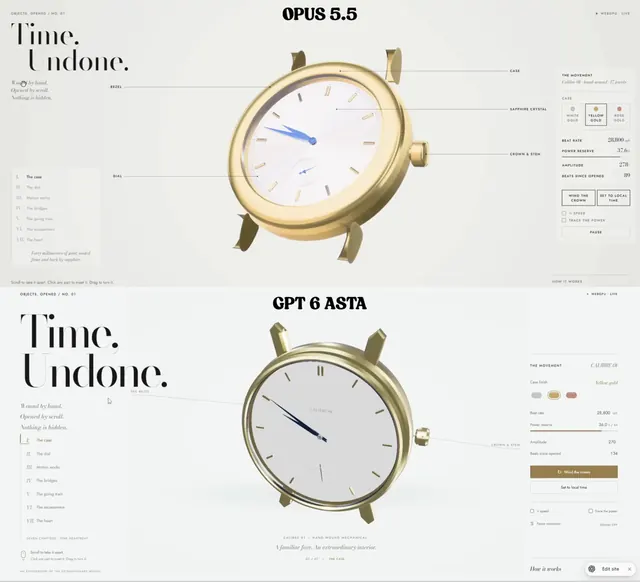
スクロールで分解される機械式腕時計、WebGPUの単一HTML
Paruchh
 Claude Opus 5.5
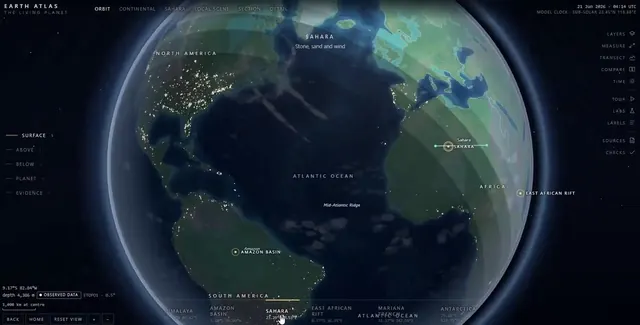
地球儀・探検・内部断面を備えた単一ファイルのSVGインタラクティブ地球アトラス
Gadgetify