

纽约一个月出租车出行的交互式3D图集(Three.js)
Astra与Three.js把纽约一个月的出租车数据做成3D图集:可按小时回放、展开24小时,或与常规日对比。
Claude Code + Three.js(仅代码)Wandy 2
创建精细的 3D 模型
单靠代码只能做出简单的形状。Wandy 2 能用一张照片生成带纹理的 3D 模型,直接用在同一个场景里。
Wandy3D 制作说明
作者没有公开提示词,因此我们写下了复现这个作品的方法。
Build an interactive 3D data atlas of New York City taxi movement with Three.js. Draw the 263 taxi zones as dark blue extruded polygons on a night-style map, and show trip volume as glowing bars. Provide four view modes: connections between zones, volume by hour, all 24 hours unfolded side by side, and a comparison view that sets each day against its typical weekday or weekend pattern. Add an hour clock with play and scrub controls to replay a month of 31 days, orbit and zoom camera controls, and a side panel with the selected zone, pickup counts, percentage change and a small hourly line chart. Use a dark UI with cool blue and white highlights. Load the data from a prepared aggregate file. Done means switching views animates smoothly and the stats update with the hour and zone.
如何使用这条提示词
在编程工具中把构建说明和一份汇总后的行程数据交给GPT-6 Astra。
换成你的城市、数据源、指标和配色,并调整需要的视图模式。
打开页面拖动时钟、切换视图,再让模型调整标签、图表或镜头。
原帖你是作者吗? 请联系我们修改或删除此页面
相似的提示词
浏览全部提示词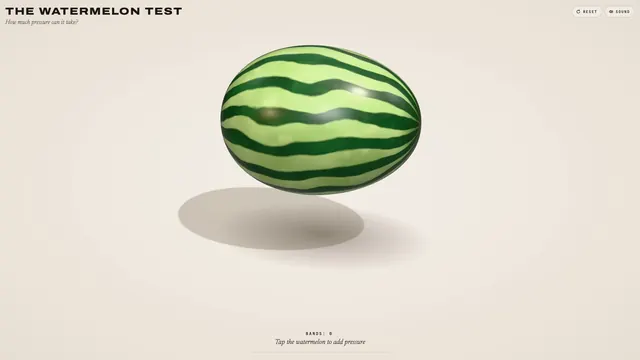 Claude Opus 5.5
皮筋捆西瓜实验:可挤压、会爆开的 3D 浏览器小玩具
林悦己Cheer
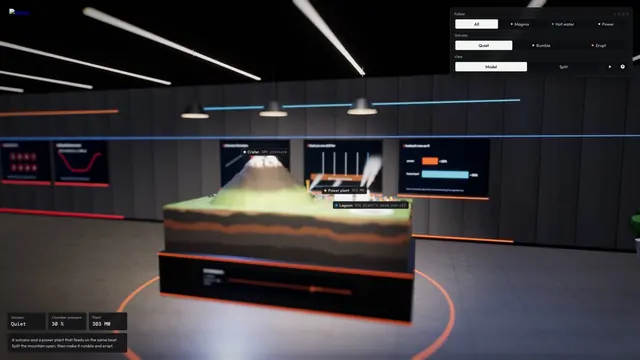 Claude Opus 5.5
带岩浆房的交互式 3D 火山剖面模拟
Konstantin Saifoulline
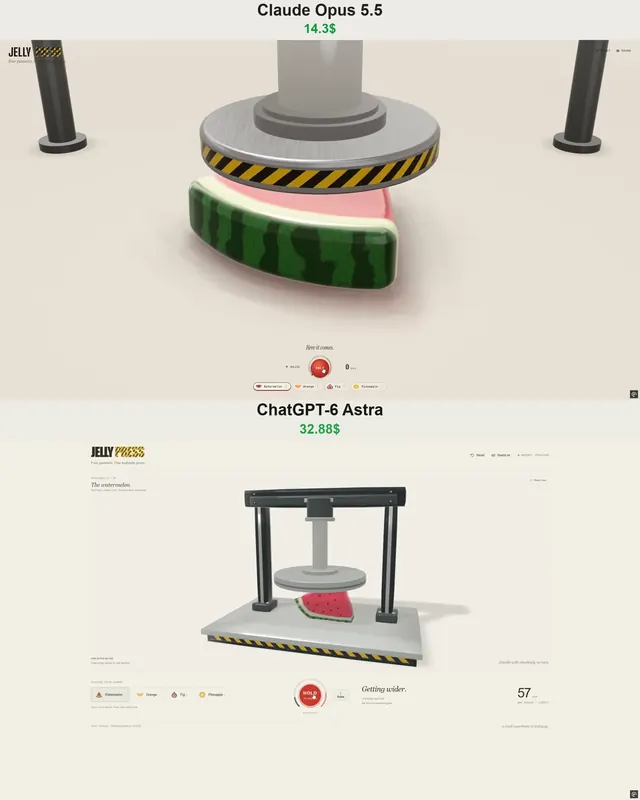 Claude Opus 5.5
WebGPU 果冻压机玩具:水果软糖被液压机压碎
Vib3Coded
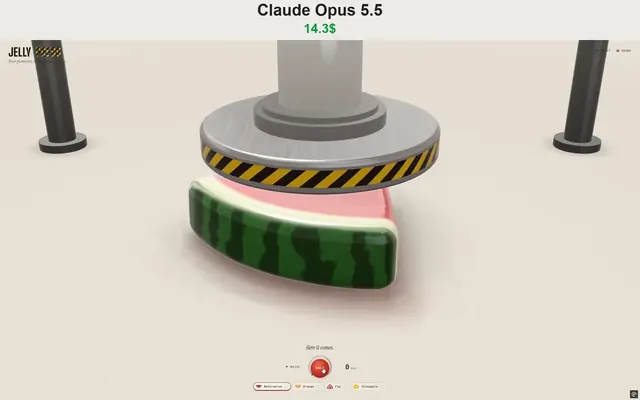 Claude Opus 5.5
WebGPU果冻压机玩具:压碎软糖水果片并抓取投掷
Vib3Coded
 Claude Opus 5.5
滚动即可拆解的机械腕表:纯WebGPU单HTML文件
Paruchh
 Claude Opus 5.5
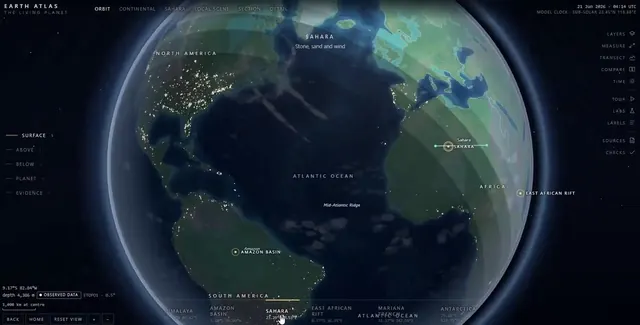
单文件交互式 SVG 地球图集:地球仪、六大考察与内部剖面
Gadgetify