

带实时 KPI、OEE 与利特尔法则的生产线离散事件仿真器
Claude Opus 5.5 生成单文件 Canvas 生产线仿真:工位与缓冲区动画,并实时显示产出、在制品和 OEE。
Claude Code + Three.js(仅代码)Wandy 2
创建精细的 3D 模型
单靠代码只能做出简单的形状。Wandy 2 能用一张照片生成带纹理的 3D 模型,直接用在同一个场景里。
Claude Opus 5.5 提示词
Build an animated, interactive discrete-event simulation of a serial production line as a single self-contained HTML file (vanilla JS + Canvas, no external libraries except Chart.js from cdnjs). Purpose: teaching [Manufacturing Systems] students how variability, buffers, and breakdowns affect line performance.

LINE CONFIGURATION (user-adjustable)
- Number of stations: [2–6], default [3], each with a name (e.g., Machining, Assembly, Inspection)
- Per station: mean cycle time, distribution (Deterministic, Uniform, Normal, Triangular, Exponential, Lognormal), CV
- Breakdowns per station: MTBF and MTTR (exponential), on/off toggle
- Quality per station: defect rate (%), with scrap or rework-loop option
- Buffers between stations: capacity 0–10 (0 = blocking after service)
- Arrivals: unlimited raw material OR Poisson arrivals with rate λ
- Customer demand to compute takt time

ANIMATION
- Parts move along conveyors and change color by stage (raw, WIP, finished, scrap)
- Machine borders show state colors: Working (green), Blocked (amber), Starved (red), Down (gray), plus a rotating gear icon and a progress bar
- Buffer slots show occupancy and highlight when full
- Controls: Play/Pause, Step, Reset, speed 1x–50x, warm-up period

KEY PERFORMANCE MEASURES (live dashboard)
1. Throughput (parts/hr) vs theoretical bottleneck rate
2. Average WIP and WIP over time
3. Flow time / manufacturing lead time (mean and 95th percentile)
4. Little's Law check: WIP ≈ Throughput × Flow time
5. Per-station utilization with a time breakdown: working / blocked / starved / down (stacked bar)
6. OEE per station = Availability × Performance × Quality
7. Bottleneck detection (active-period method) and highlight the bottleneck
8. Takt time vs station cycle times (line balance chart)
9. Line balance efficiency = Σ cycle times / (N × max cycle time)
10. First-pass yield, rolled throughput yield, scrap count
11. Average buffer occupancy per buffer
12. Observed vs set cycle-time mean and CV per station

ANALYSIS FEATURES
- Replication mode: run N replications of length T after warm-up, report mean ± 95% confidence interval for throughput, WIP, and flow time
- Experiment mode: sweep buffer size (or one station's CV) and plot throughput vs parameter
- Export results to CSV
- Preset scenarios: Balanced line, Clear bottleneck, High variability, Unreliable machine

DESIGN
- Clean, responsive layout that works on mobile; light/dark mode
- Brief tooltip explaining each KPI and its formula
- Bilingual labels (English/Arabic) toggle
如何使用这条提示词
把提示词粘贴到 Claude Opus 5.5,并填写方括号中的课程、工位数量和范围。
按你的产线修改工位名称、分布、故障参数、预设场景和语言切换。
打开单个 HTML 文件,运行预设并观察瓶颈;可要求增加 KPI 或实验后继续迭代。
原帖你是作者吗? 请联系我们修改或删除此页面
相似的提示词
浏览全部提示词 Claude Opus 5.5
皮筋捆西瓜实验:可挤压、会爆开的 3D 浏览器小玩具
林悦己Cheer
 Claude Opus 5.5
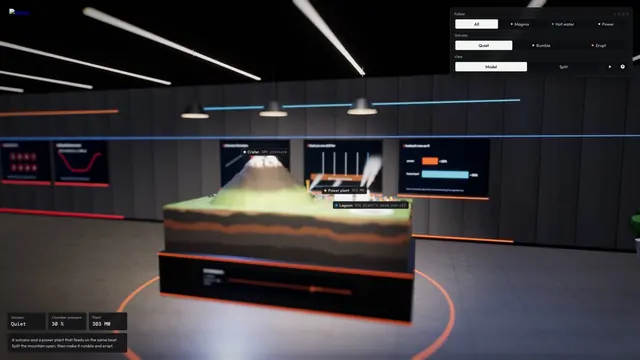
带岩浆房的交互式 3D 火山剖面模拟
Konstantin Saifoulline
 Claude Opus 5.5
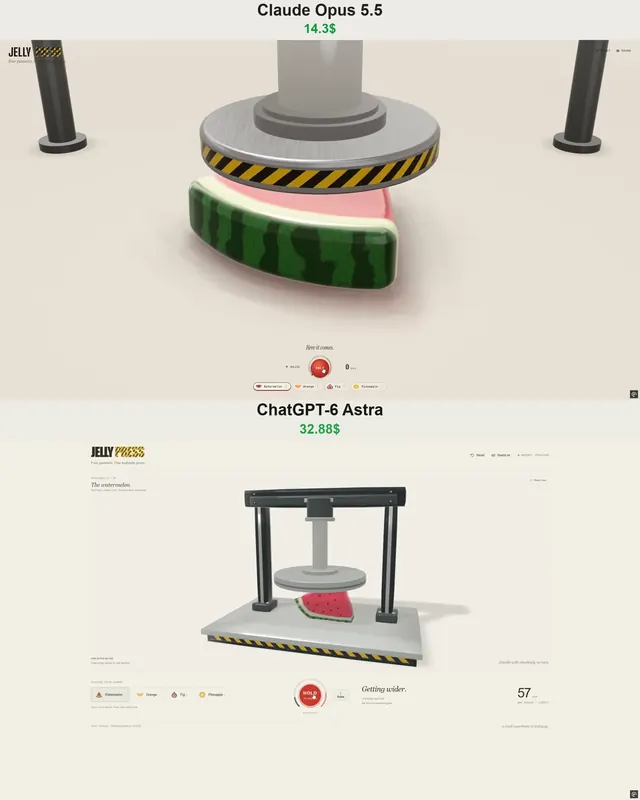
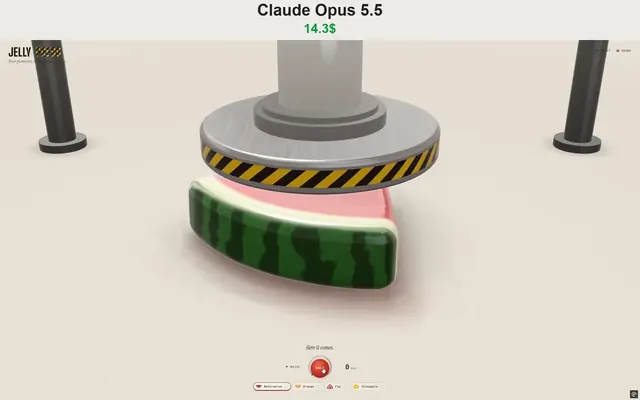
WebGPU 果冻压机玩具:水果软糖被液压机压碎
Vib3Coded
 Claude Opus 5.5
WebGPU果冻压机玩具:压碎软糖水果片并抓取投掷
Vib3Coded
 Claude Opus 5.5
滚动即可拆解的机械腕表:纯WebGPU单HTML文件
Paruchh
 Claude Opus 5.5
单文件交互式 SVG 地球图集:地球仪、六大考察与内部剖面
Gadgetify